
COVID-19 and Anti-AAPI Hate Crimes in California
With news outlets and social media reporting a recent surge in anti-AAPI hate crimes, detailing incident after incident, it is important to note: Racism is nothing new, we just have wider accessibility through technology to what is happening beyond our immediate communities—we must look to the data to get the full story.
The following is a case study utilizing public data sourced by the California Department of Justice and public data scraped from Twitter. This is a data exploration into anti-AAPI hate crimes in California as it relates to the 2020 and ongoing pandemic. California is a focal point given its unique position as the US state with the largest Asian American and Pacific Islander (AAPI) population, also accounting for nearly a third of the overall AAPI population in the US (Pew Research).
About the Data
The Department of Justice (DOJ) Criminal Justice Statistics Center (CJSC) collects information on hate crimes. The Hate Crime database (HATE) data are submitted to the DOJ monthly by various law enforcement agencies (LEAs) throughout the state. Hate crime acts involves the intent to cause physical injury, emotional suffering, or property damage where there is a reasonable cause to believe that the crime was motivated by the victim’s race, ethnicity, religion, gender, sexual orientation, or physical or mental disability.
Local law enforcement agencies are required to report hate crimes to the Department of Justice (DOJ) in compliance with California Penal Code Section 13023. California Penal Code Section 422.55 defines a hate crime as “a criminal act committed, in whole or in part, because of one or more of the following actual or perceived characteristics of the victim: (1) disability, (2) gender, (3) nationality, (4) race or ethnicity, (5) religion, (6) sexual orientation, (7) association with a person or group with one or more of these actual or perceived characteristics.”
The DOJ requested that each law enforcement agency establish procedures incorporating a two tier review (decision-making) process. The first level is done by the initial officer who responds to the suspected hate crime incident. At the second level, each report is reviewed by at least one other officer to confirm that there was sufficient evidence to report the event as a hate crime.
The following factors may influence the volume of hate crimes reported to the DOJ:
Cultural practices of individuals and their likeliness to report hate crimes to law enforcement agencies
Strength and investigative emphasis of law enforcement agencies
Policies of law enforcement agencies
Community policing policies
Prepare/Process Data
Given the large size of the CA DOJ dataset, I used R via RStudio to prepare, process, and analyze, with visualizations created using Tableau
Utilized SUBSET function to filter data to only include entries from years 2010-2020 (original dataset encompasses 2001-2020 data)—We still want to include data from prior years to contextualize the data exploration, focusing on the past decade.
Cleaned to remove irrelevant data and renamed/replaced all “Suspects’ Racial Group” entries that fall under the AAPI umbrella to “AAPI”
Analyze
First, let’s take a look at how hate crimes in California as a whole have progressed from 2010 to 2020.
We observe that compared to 2010, 2020 saw a 20% increase in reported hate crimes. When compared to 2019, that increase was 30%, the highest increase of any year-to-year comparison within 2010-2020, let alone 2019 to 2020. Within 2010-2020, with regard to the suspects’ racial group, 46% of reported cases are unknown or comprised of multiple groups. White suspects account for the largest proportion of cases (31%), followed by Black/African-American (13%) and Hispanic (8%). When only considering reported cases with known or multiple racial groups of suspects, these numbers become 53%, 22%, and 14%, respectively.
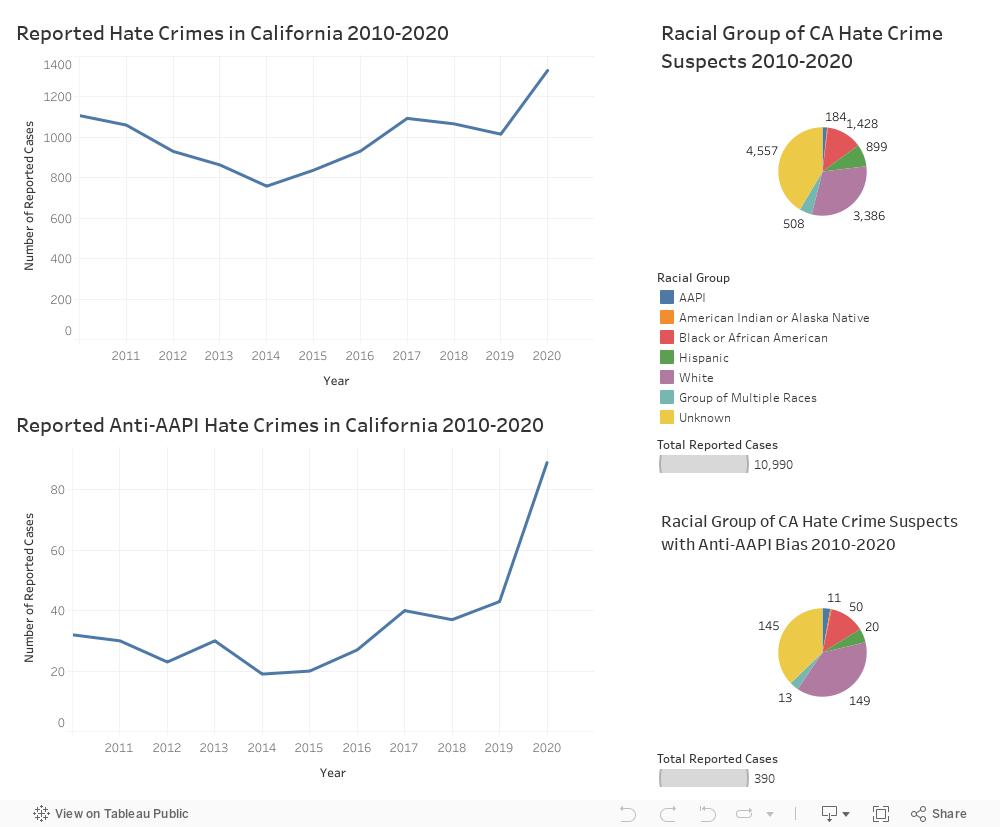
When we filter the data for incidents committed by suspects with anti-AAPI bias:
Compared to 2010, 2020 saw a 178% increase in reported hate crimes with anti-AAPI bias and a 107% increase when compared to 2019, the highest increase of any single year comparison within 2010-2020 (e.g. 2012-2013, 2016-2017). Within 2010-2020, with regard to suspects’ racial group, 41% of reported cases are unknown or comprised of multiple groups. Once again, White suspects account for the largest proportion of cases (38%), followed by Black/African-American (13%) and Hispanic (5%). When only considering reported cases with known or multiple racial groups of suspects, these numbers become 61%, 20%, and 8%, respectively.
Twitter Scraping and Natural Language Processing (NLP) Analysis
For further context, to compare any changes in verbiage with regard to common racially-insensitive labels for the coronavirus (SARS-CoV-2) and COVID-19, I used Python to scrape public data off Twitter to analyze. I chose to narrow the timeline to the March-April period given March 2020 was the month the World Health Organization (WHO) declared COVID-19 a pandemic and the US began lockdowns. I utilized the Twint and Pandas packages for data collection and organization and the Natural Language Toolkit (NLTK) and Seaborn packages for analysis and visualization.
Important dates to note:
March 11, 2020: WHO declares COVID-19 a pandemic
March 16, 2020: Then-president Donald Trump tweets about coronavirus using term “Chinese Virus”
March 17, 2020: Trump official refers to COVID-19 as “Kung Flu”
March 23, 2020: Then-president Donald Trump tweets and states in press conference in defense of Asian-Americans
March 16, 2021: Atlanta Spa Shootings kill 8, 6 of which are of Asian descent
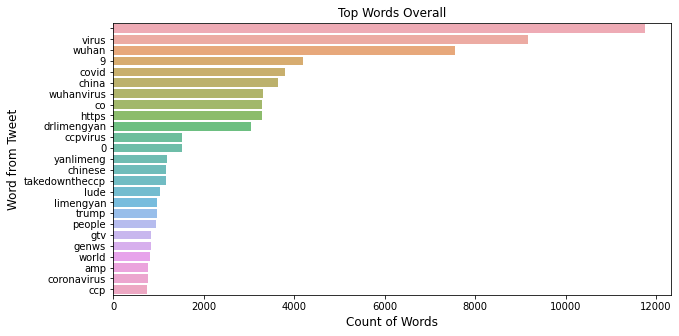
The following visualizations reflect the top 25 words used in the 10,000 collected tweets per time period. Word usage remained rather consistent, except for “Wuhan Virus” tweets, most likely a result of current events regarding SARS-CoV-2’s origins within Wuhan, China.

“Kung Flu” Tweets 3/1/2020-4/1/2020

“Chinese Virus” Tweets 3/1/2020-4/1/2020

“Wuhan Virus” Tweets 3/1/2020-4/1/2020

“Kung Flu” Tweets 3/1/2021-4/1/2021

“Chinese Virus” Tweets 3/1/2021-4/1/2021
“Wuhan Virus” Tweets 3/1/2021-4/1/2021
Key Findings
In the past decade, hate crimes in California have increased (20% overall compared to 2010, 178% compared to 2010 when only considering cases with anti-AAPI biased suspects).
2020 saw the largest increase in hate crimes in California within 2010-2020 when compared to the previous year (30% overall compared to 2019, 107% compared to 2019 when only considering cases with anti-AAPI biased suspects).
White suspects account for the largest proportion of reported cases within 2010-2020 (31% overall and 38% when only considering cases with anti-AAPI biased suspects). These numbers become 53% and 61%, respectively, when we only account for known or multiple racial groups of suspects.
Word usage of tweets containing racially-insensitive labels for SARS-CoV-2 and COVID-19 remained rather consistent a year apart.
Other factors to take into consideration:
The CA DOJ dataset does not include racial group of victims, which would further contextualize the data and its story.
Cases are underreported due to language barrier/cultural practices of victims and their communities.
Cultural diversity and population density; size of law enforcement agencies; and the training received in the identification of hate crimes by law enforcement officers in each jurisdiction.
Other Considerations for Future Exploration
Conduct a broader analysis by aggregating hate crime data from the 10 largest cities in the US by population: 2019 vs. 2020, first half 2019 vs. first half 2020 vs. first half 2021).
Conduct field research and analysis on Chinatowns across the US and the social and economic impact of the pandemic.
Conduct a sentiment analysis of the collected tweets to discern hate speech over time.
Data Sources:
CA Dept. of Justice 2001-2020 Hate Crime Data